___________________________________________________________________
The wind systems that exist over the earth's surface are a result of
variations in air pressure. These are in turn due to the variations in solar
heating. Warm air rises and cooler air rushes in to take its place. Wind is
merely the movement of air from one place to another. There are global wind
patterns related to large scale solar heating of different regions of the
earth's surface and seasonal variations in solar incidence. There are also
localised wind patterns due the effects of temperature differences between land
and seas, or mountains and valleys. Wind speed generally increases with height
above ground. This is because the roughness of ground features such as
vegetation and houses cause the wind to be slowed.
Windspeed data can be obtained from wind maps or from the meteorology office.
Unfortunately the general availability and reliability of windspeed data is
extremely poor in many regions of the world. However, significant areas of the
world have mean annual windspeeds of above 4-5 m/s (metres per second) which
makes small-scale wind powered electricity generation an attractive option. It
is important to obtain accurate windspeed data for the site in mind before any
decision can be made as to its suitability. Methods for assessing the mean
windspeed are found in the relevant texts (see the 'References and resources'
section at the end of this fact sheet).
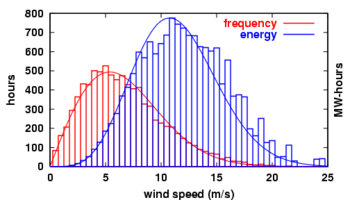
The power in the wind can be extracted by allowing it to blow past moving
wings that exert torque on a rotor. The amount of power transferred is directly
proportional to the density of the air, the area swept out by the rotor, and the
cube of the wind speed.
The Energy E available in the wind is
given by:
The
mass flow of air that travels through the swept area of a wind turbine
varies with the wind speed and air density. As an example, on a cool 15°C (59°F)
day at sea level, air density is 1.225 kilograms per cubic metre. An 8 m/s
breeze blowing through a 100 meter diameter rotor would move almost
77,000 kilograms of air per second through the swept area.
The
kinetic energy of a given mass varies with the square of its velocity.
Because the mass flow increases linearly with the wind speed, the wind energy
available to a wind turbine increases as the cube of the wind speed. The power
of the example breeze above through the example rotor would be about
2.5 megawatts.
As the wind turbine extracts energy from the air flow, the air is slowed
down, which causes it to spread out and diverts it around the wind turbine to
some extent.
Albert Betz, a German physicist, determined in 1919 (see
Betz' law) that a wind turbine can extract at most 59% of the energy that
would otherwise flow through the turbine's cross section. The Betz limit applies
regardless of the design of the turbine.
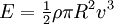
Distribution of wind speed (red) and energy (blue) for all
of 2002 at the Lee Ranch facility in Colorado. The histogram
shows measured data, while the curve is the Rayleigh model
distribution for the same average wind speed. Energy is the
Betz limit through a 100 meter diameter circle facing
directly into the wind. Total energy for the year through
that circle was 15.4
gigawatt-hours.
Windiness varies, and an average value for a given location does not alone
indicate the amount of energy a wind turbine could produce there. To assess the
climatology of wind speeds at a particular location, a probability distribution
function is often fit to the observed data. Different locations will have
different wind speed distributions. The distribution model most frequently used
to model wind speed climatology is a two-parameter
Weibull distribution because it is able to conform to a wide variety of
distribution shapes, from Gaussian to exponential. The
Rayleigh model, an example of which is shown plotted against an actual
measured dataset, is a specific form of the Weibull function in which the shape
parameter equals 2, and very closely mirrors the actual distribution of hourly
wind speeds at many locations.
Because so much power is generated by higher windspeed, much of the average
power available to a windmill comes in short bursts. The 2002 Lee Ranch sample
is telling; half of the energy available arrived in just 15% of the operating
time. The consequence of this burstiness is that wind energy is not dispatchable
as for fuel-fired power plants; additional output cannot be supplied in response
to load demand. Since wind speed is not constant, a wind generator's annual
energy production is never as much as its nameplate rating multiplied by the
total hours in a year. The ratio of actual productivity in a year to this
theoretical maximum is called the
capacity factor. A well-sited wind generator will have a capacity factor of
about 35%. This compares to typical capacity factors of 90% for nuclear plants,
70% for coal plants, and 30% for oil plants.[6]
When comparing the size of wind turbine plants to fueled
power plants, it is important to note that 1000 kW of wind-turbine potential
power would be expected to produce as much energy in a year as approximately
500 kW of coal-fired generation. Though the short-term (hours or days) output of
a wind-plant is not completely predictable, the annual output of energy tends to
vary only a few percent points between years. When storage, such as with
pumped hydroelectric storage, or other forms of generation are used to
"shape" wind power (by assuring constant delivery reliability), commercial
delivery represents a cost increase of about 25%, yielding viable commercial
performance.[7]
Electricity consumption can be adapted to production variability to some extent
with
Energy Demand Management and
smart meters that offer variable market pricing over the course of the day.
For example, municipal water pumps that feed a water tower do not need to
operate continuously and can be restricted to times when electricity is
plentiful and cheap. Consumers could choose when to run the dishwasher or charge
an electric vehicle, making it very convenient.
The fact that the power is proportional to the cube of the windspeed is very
significant. This can be demonstrated by pointing out that if the wind speed
doubles then the power in the wind increases by a factor of eight. It is
therefore worthwhile finding a site which has a relatively high mean windspeed.
